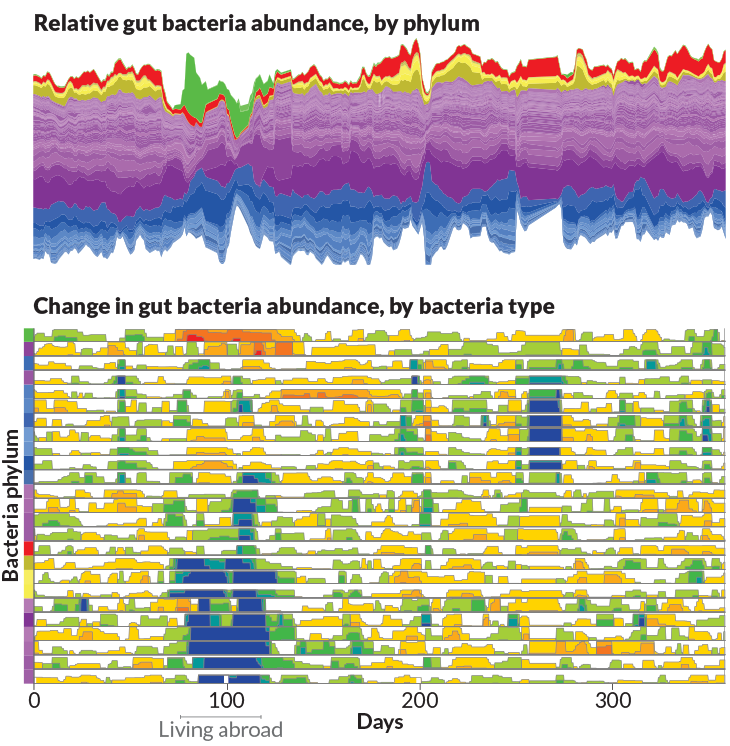
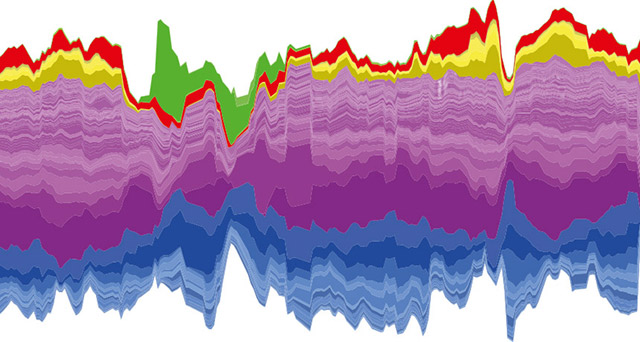
This amazing visual of one scientists gut microbe changes over a year is an eye-opener to how much your environment and diet can affect your gut.
Where you live and what you eat can rapidly affect the types of good bacteria in your body. To learn how this bacteria changes over time, Duke University computational biologist Lawrence David archived his microbiome for a whole year.
The stream plot below (top graph) shows the changes in his gut bacteria over time. The thickness of each stream represents a different type of bacteria and its abundance in daily fecal samples.

David took a closer look at the data in a horizon plot (bottom graph; colored squares at left indicate the phylum of the bacteria represented in each row).
First, he calculated the normal levels of bacteria in his gut, then calculated how much they differed from the median. The warmer colors (red, orange, yellow) represent groups of bacteria that increase in abundance, and cooler colors (blue, green) represent a decrease in abundance.
Living abroad from day 71 to 122 caused a dramatic, but a short and temporary effect on David’s microbiome.
Note: None of the information in our website is intended to diagnose, treat, cure or prevent any illness or disease. The content on our website is for educational purposes only.
DON’T FORGET to sign up for our weekly newsletter to get our latest articles, updates, free recipes and giveaways.
The scary way lack of sleep affects your gut.
Ice cream and peanut butter cause gut inflammation.
Top 5 fermented foods for gut health.
REFERENCES:
1. “How One Scientist’s Gut Microbes Changed over a Year.” Science News. Science News, 22 Sept. 2016. Web. 10 Jan. 2017.
2. “Host Lifestyle Affects Human Microbiota on Daily Timescales.” Genome Biology. Genome Biology, n.d. Web. 10 Jan. 2017.


